Every tool to run cloud, on one desk
Six My Desk DevOps capabilities that share one live picture of your estate — so the cost view, the alert and the fix all agree.
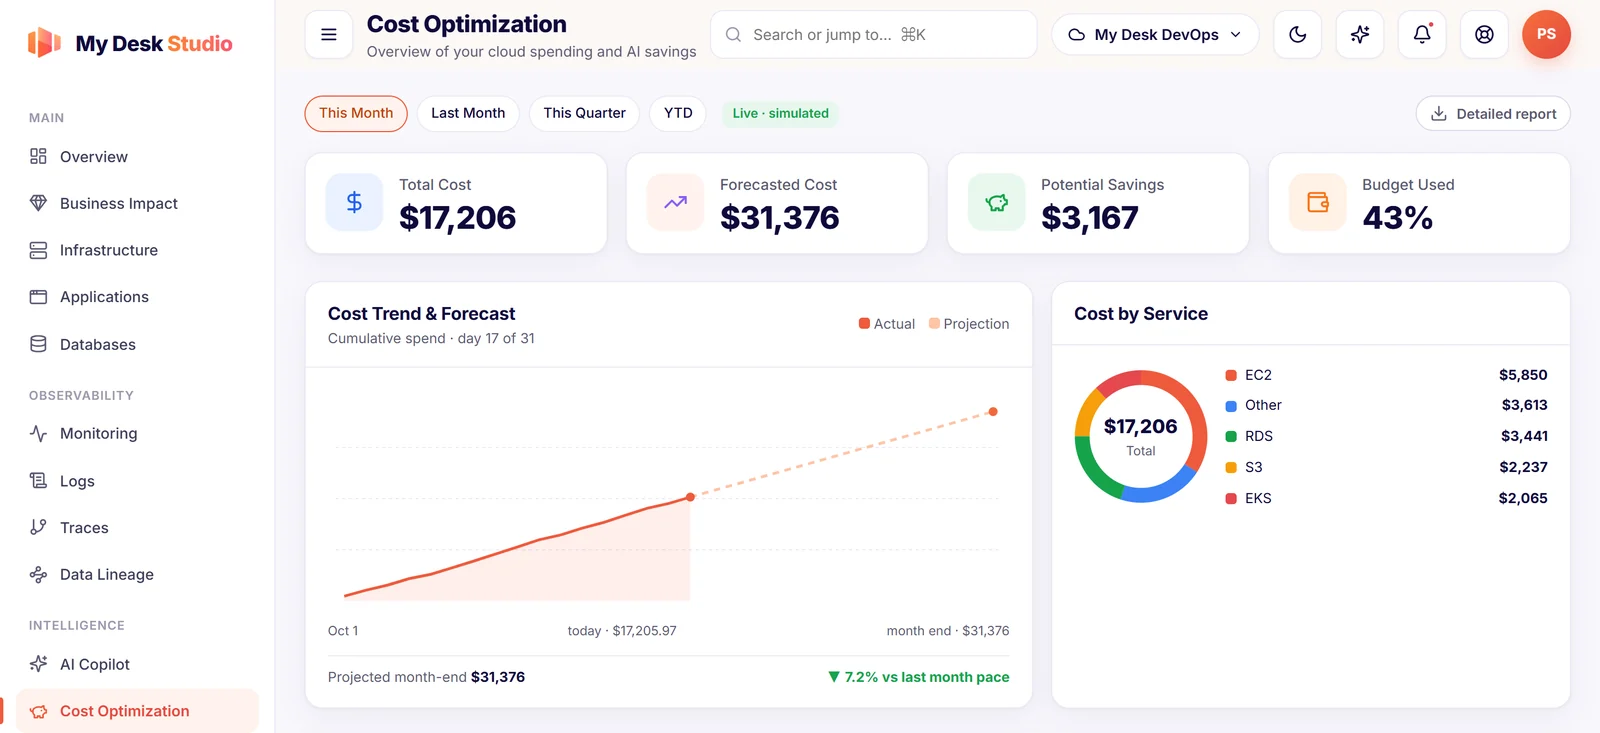
Find the money you're wasting
Every recommendation is priced from your real bill, ranked by savings, and comes with the exact steps to apply it.
- Idle and oversized instances, databases and volumes
- Spend by service, account, region and tag
- Month-end forecasts and budget alerts
- Savings Plan and Reserved Instance coverage
- Anomaly alerts when spend jumps unexpectedly
Ask your cloud anything
Copilot has live context across metrics, logs, cost and incidents — so answers cite your real resources, not generic advice.
- Plain-English questions, ranked answers
- Root-cause analysis on any alert, in one click
- Remediation plans with the exact commands
- Every answer grounded in your latest snapshot
1. Scale to db.r6g.large (≈ +$96/mo)
2. Add an index on
orders(customer_id, created_at)3. Enable Performance Insights to confirm
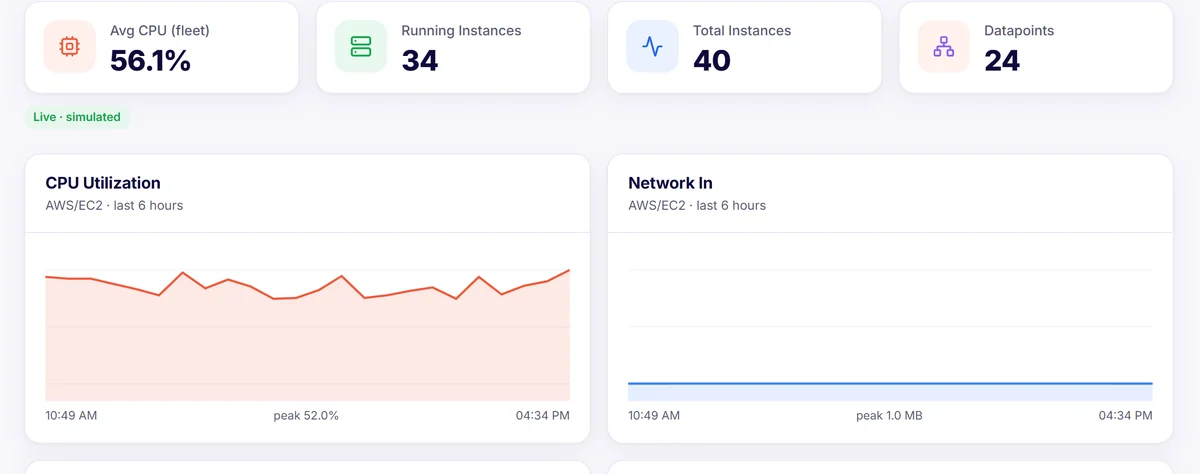
Metrics, logs and traces — together
CloudWatch, Azure Monitor and Google Cloud signals in one timeline, with alerts routed to where your team already works.
- Infrastructure, application and database health
- Log search and distributed traces (X-Ray, App Insights)
- Alerts to Slack, Teams, PagerDuty, Opsgenie
- Availability and SLA tracking
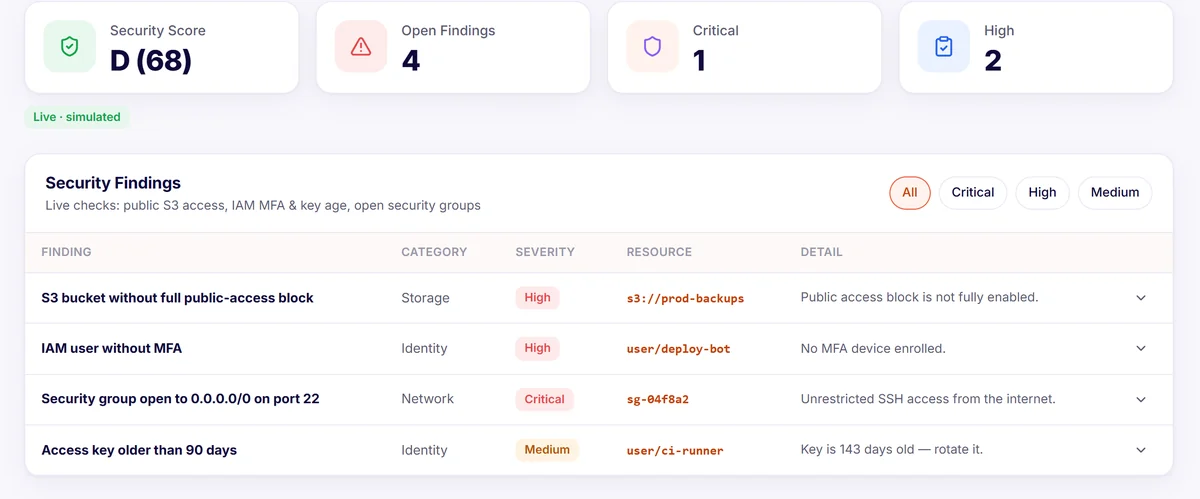
Know your risks, fix them fast
Continuous checks across IAM, storage and networking, scored and mapped to common compliance controls.
- Public buckets, open security groups, stale keys
- Posture score with trend over time
- Compliance views (CIS-style controls)
- Step-by-step remediation for every finding
Workflows with guardrails
Turn findings into action automatically — with dry runs, approvals and a full audit trail.
- Triggers: cost spikes, alerts, schedules, findings
- Actions: stop instances, tag resources, notify, AI analysis
- Dry-run by default; spend caps on anything that creates resources
- AI provisioning advisor with Terraform output
Reports leadership actually reads
AI-written summaries of cost, reliability and risk — generated in seconds, exported as PDF or CSV.
- Weekly and monthly executive summaries
- Business impact view: cost per product and team
- Scheduled delivery to email and Slack
Cloud spend fell 12.5% to $24,510 after rightsizing the orders database and removing idle capacity. Availability held at 99.95%. Two high-risk findings remain open.
AWS, Azure and Google Cloud — one view
Read-only connectors for each cloud, with resource groups and per-group access for teams and clients.
Amazon Web Services
Cross-account IAM role, Cost Explorer, CloudWatch, X-Ray and more.
Microsoft Azure
Reader + Cost Management Reader via a service principal.
Google Cloud
Viewer + Billing Account Viewer via a service account.
See it on your own cloud
Connect one account free and get your first savings report today.